
Candlestick graphs, which are also known as candlestick charts are one of the most popular ways to visualize stock data. They are easy to read and provide a good overview of price action. In this article, we will look at the basics of candlestick graphs and how to interpret them. Keep reading to learn more.
What is a candlestick graph?
Candlestick graphs are a type of bar chart known for their candlestick shape used by traders and data analysts who can work for traders to track the price action of a security from lowest price to highest price. They are very similar to line graphs, with the exception that candlestick graphs use small bars or “candles” to represent the price action of a security over time. The body of the candlestick indicates the open and close prices for the given time, while the wicks on either end show the high and low prices for that time.
One of the benefits of using candlestick graphs is that they can be used to identify patterns in price action. These patterns can then be used by traders to make trading decisions. For example, some common candlestick patterns include bullish patterns, bearish patterns, Doji candles, and spinning tops.
What are some tips for using candlestick graphs to trade stocks?
Candlestick graphs are also used by traders to track the price of a security over time. They are like line graphs but use small bars instead of lines to represent the price action. The color and shape of each bar can provide important clues about what is happening in the market.
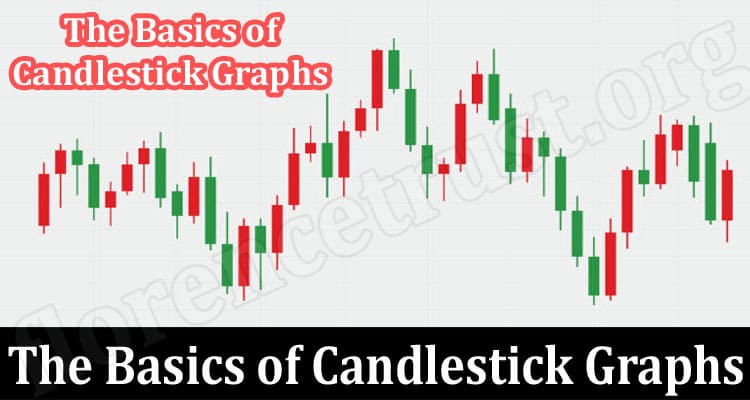
The body of the candle indicates whether the stock closed higher or lower than it opened. A green candle means that the stock closed higher than it opened, while a red candle means that the stock closed lower than it opened.
The wick (or shadow) of the candle shows how high or low the stock traded during the day. The top of the wick indicates the high point for the day, while the bottom of the wick indicates the low point for the day.
If there is no wick on either end, then it was a relatively calm day with little volatility. This usually happens at market bottoms and tops, when there isn’t much selling or buying pressure pushing prices up or down.
What is an inverted hammer candle?
Inverted hammer candles are reversal bullish patterns that form when a security falls significantly in price, then rallies sharply to close near its opening price. The length of the candle’s body is not as important as the relationship of the candle’s wick to its body. The wick should be at least twice the length of the body. Inverted hammers indicate that selling pressure has abated and that buyers are starting to take control of the market. They typically precede strong uptrends and should be used in conjunction with other technical indicators.
What is an engulfing bullish pattern candlestick chart?
The bullish engulfing pattern is a two-day candlestick pattern that signals that the bears have lost control of the market and that the bulls are taking over. The first day is a red candle, which represents the bears’ power in the market. The second day is a green candle, which represents the bulls’ power in the market. The green candle completely engulfs the red candle, indicating that the bulls have taken over and are now in control of the market.
What is a shooting star candlestick graph?
A shooting star candlestick is an indicator that a security’s price may be about to fall. It is represented by a small body with long upper and lower shadows, which indicates that the security’s open and close prices were at opposite ends of the day’s trading range. The shooting star candlestick usually appears after an advance in the price of the security, indicating that buyers are starting to lose interest and sellers are beginning to take control.
Overall, the basics of candlestick graphs are important to understand because they are a visual representation of how price security has traded over a period. This information can be used to help predict future price movements.